MS and MS/MS
Mar Garcia-Aloy
Mass Spectrometry
MS is a wide-ranging analytical technique that relates to the production and detection of charged species.
The basic principle of MS is to generate ions from compounds by a method that would be able to separate these ions by their mass-to-charge ratio (m/z) and to detect them by their respective m/z and abundances.
Ionization is the process whereby electrons are either removed or added to atoms or molecules to produce ions.
CHROMacademy: LC-MS Interpretation
Mol Nutr Food Res 2019;63(1):e1800384. doi: 10.1002/mnfr.201800384
Structure of a Mass Spectrometer
P. Franceschi, Metabolomics Lectures (2022). GitHub repository:
https://github.com/pietrofranceschi/Metabolomics_lectures
Some basic concepts…
A simple mass spectrum is represented by a two dimensional bar plot:

CHROMacademy: LC-MS Interpretation
Some basic concepts…
Usually each compound produce >1 ion
P. Franceschi, Metabolomics Lectures (2022). GitHub repository:
https://github.com/pietrofranceschi/Metabolomics_lectures
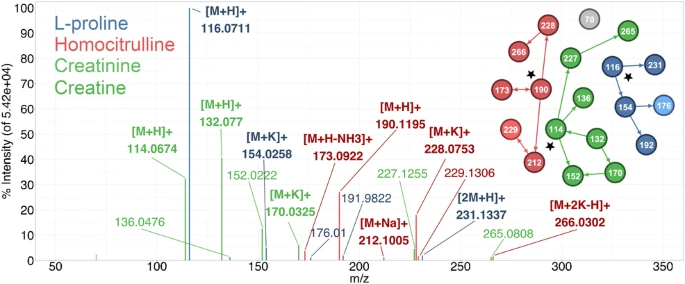
Anal Bioanal Chem. 2021 Jan;413(2):503-517. doi: 10.1007/s00216-020-03019-3
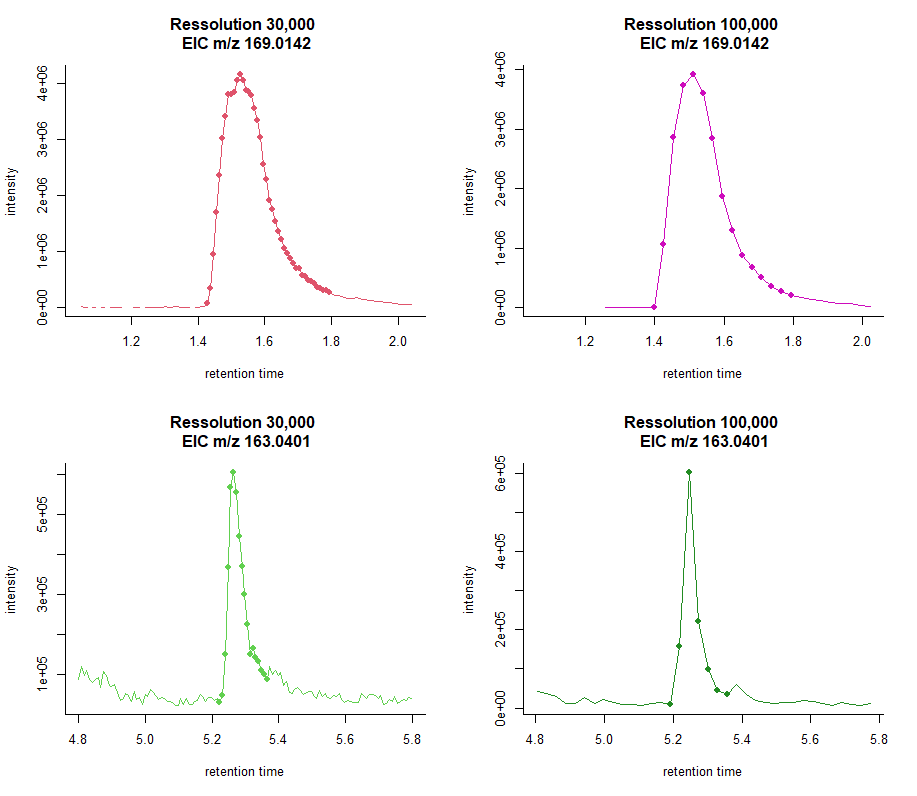
Points-per-peak
Enough data points per chromatographic peak
(i.e., at least 7–8)

Mass Spectrom Rev. 2021. doi: 10.1002/mas.21715
Points-per-peak
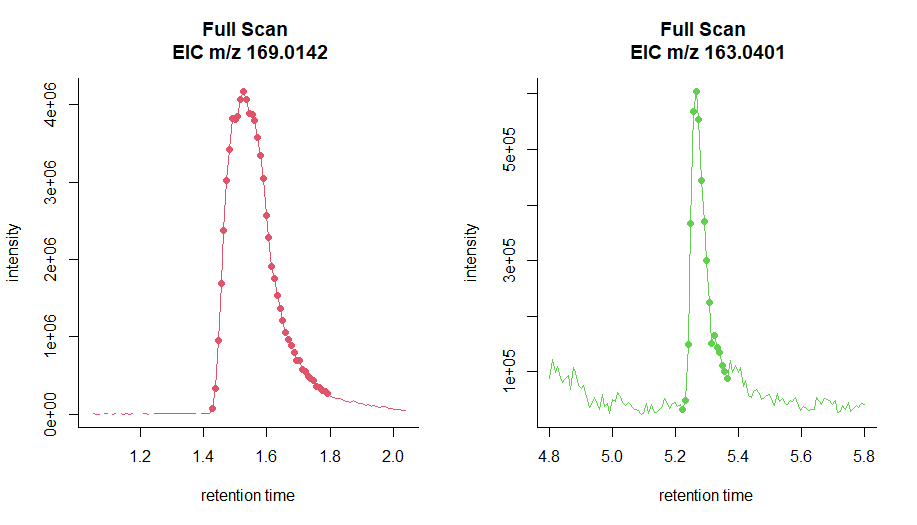
Mass resolution
Ability of a mass analyzer to separate two adjacent peaks:
- Low-resolution mass spectrometers (LRMS) can separate sufficiently two ions differing by one mass unit
- High-resolution mass instruments (HRMS) can discriminate between isobaric species, even with in complex matrices
- Low-resolution mass spectrometers (LRMS) can separate sufficiently two ions differing by one mass unit
HRMS instruments are required to determine the elemental composition.
CHROMacademy: LC-MS Interpretation
Mol Nutr Food Res 2019;63(1):e1800384. doi: 10.1002/mnfr.201800384
Resolving power
RP = M / d(M)
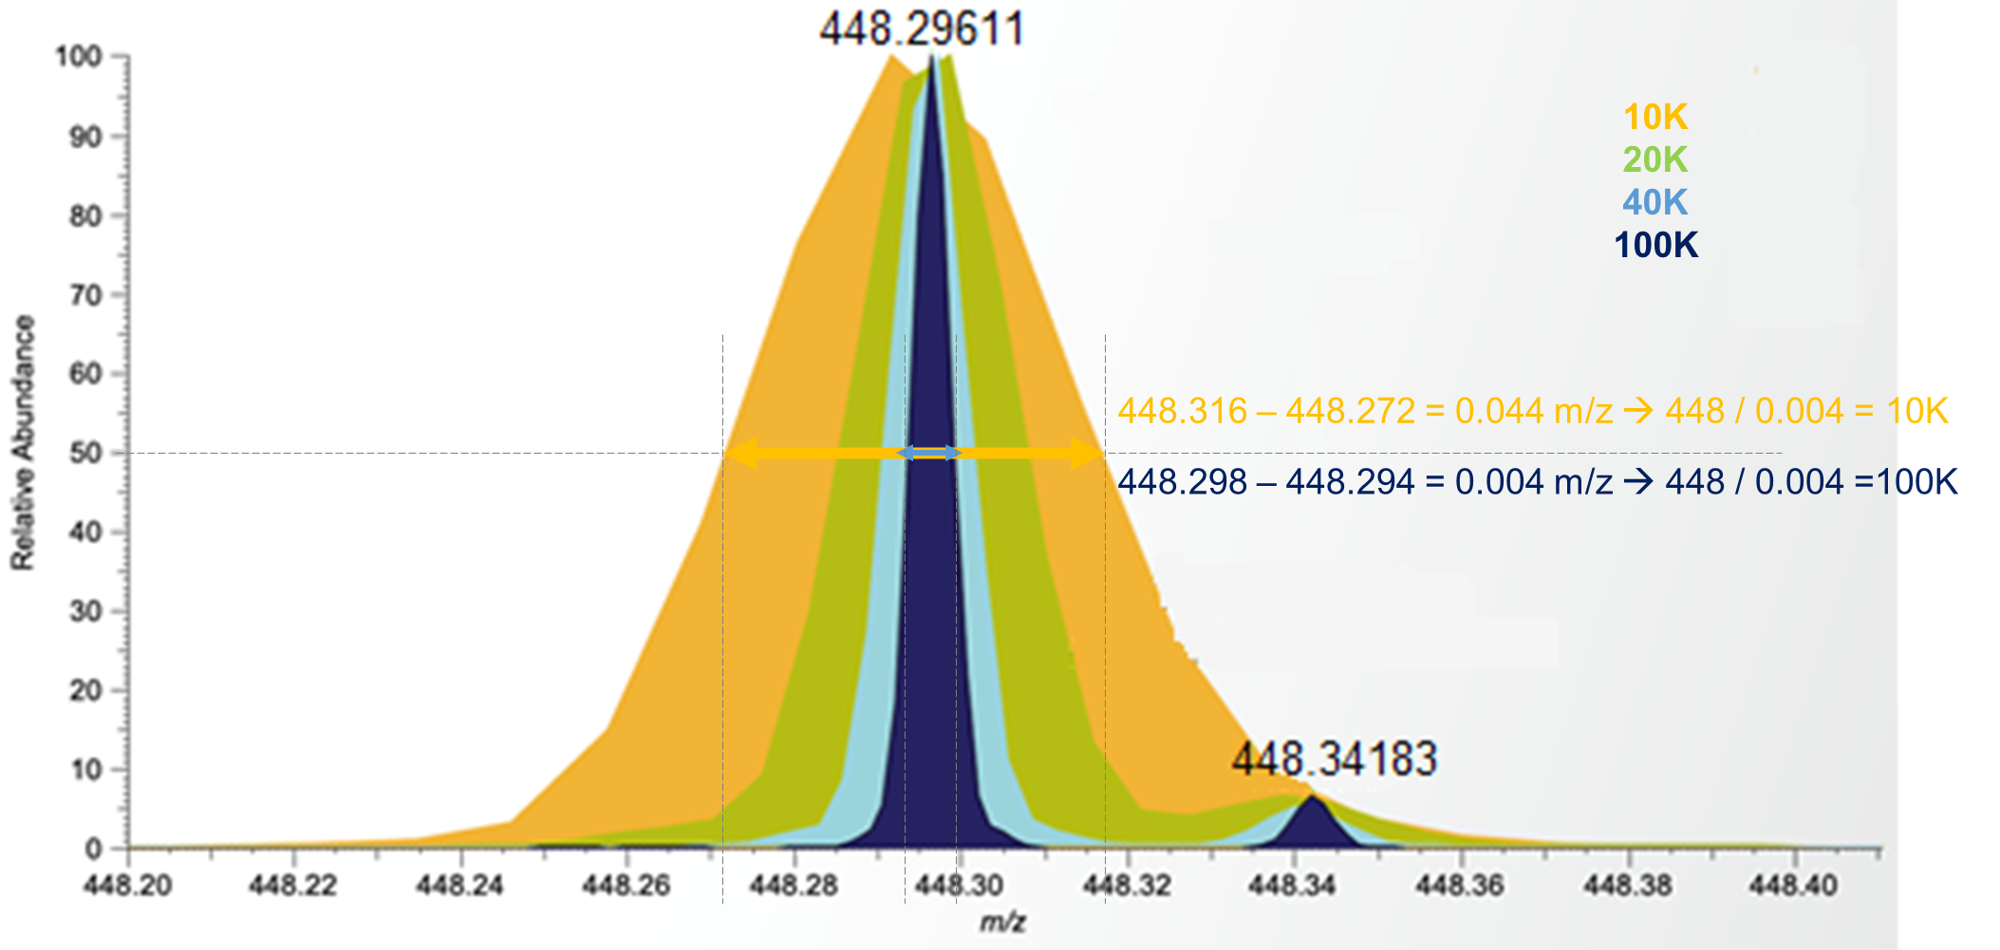
Adapted from:
https://www.technologynetworks.com/proteomics/articles/the-full-picture-the-right-picture-high-resolution-mass-spectrometry-for-metabolomic-profiling-354791
Isotopic patterns
| Isotope | Mass | d(Mass) | Abundance |
|---|---|---|---|
| C(12) | 12.000000 | 0.000000 | 98.900 |
| C(13) | 13.003355 | 1.003355 | 1.100 |
| N(14) | 14.003074 | 0.000000 | 99.630 |
| N(15) | 15.000109 | 0.997035 | 0.370 |
| O(16) | 15.994915 | 0.000000 | 99.760 |
| O(17) | 16.999131 | 1.004216 | 0.038 |
| O(18) | 17.999159 | 2.004244 | 0.200 |
| H(1) | 1.007825 | 0.000000 | 99.900 |
| H(2) | 2.014102 | 1.006277 | 0.015 |
Isotopic patterns
Theoretical isotopic pattern calculator: enviPat
Check examples with: C7H6O5 and C8H12N4O3
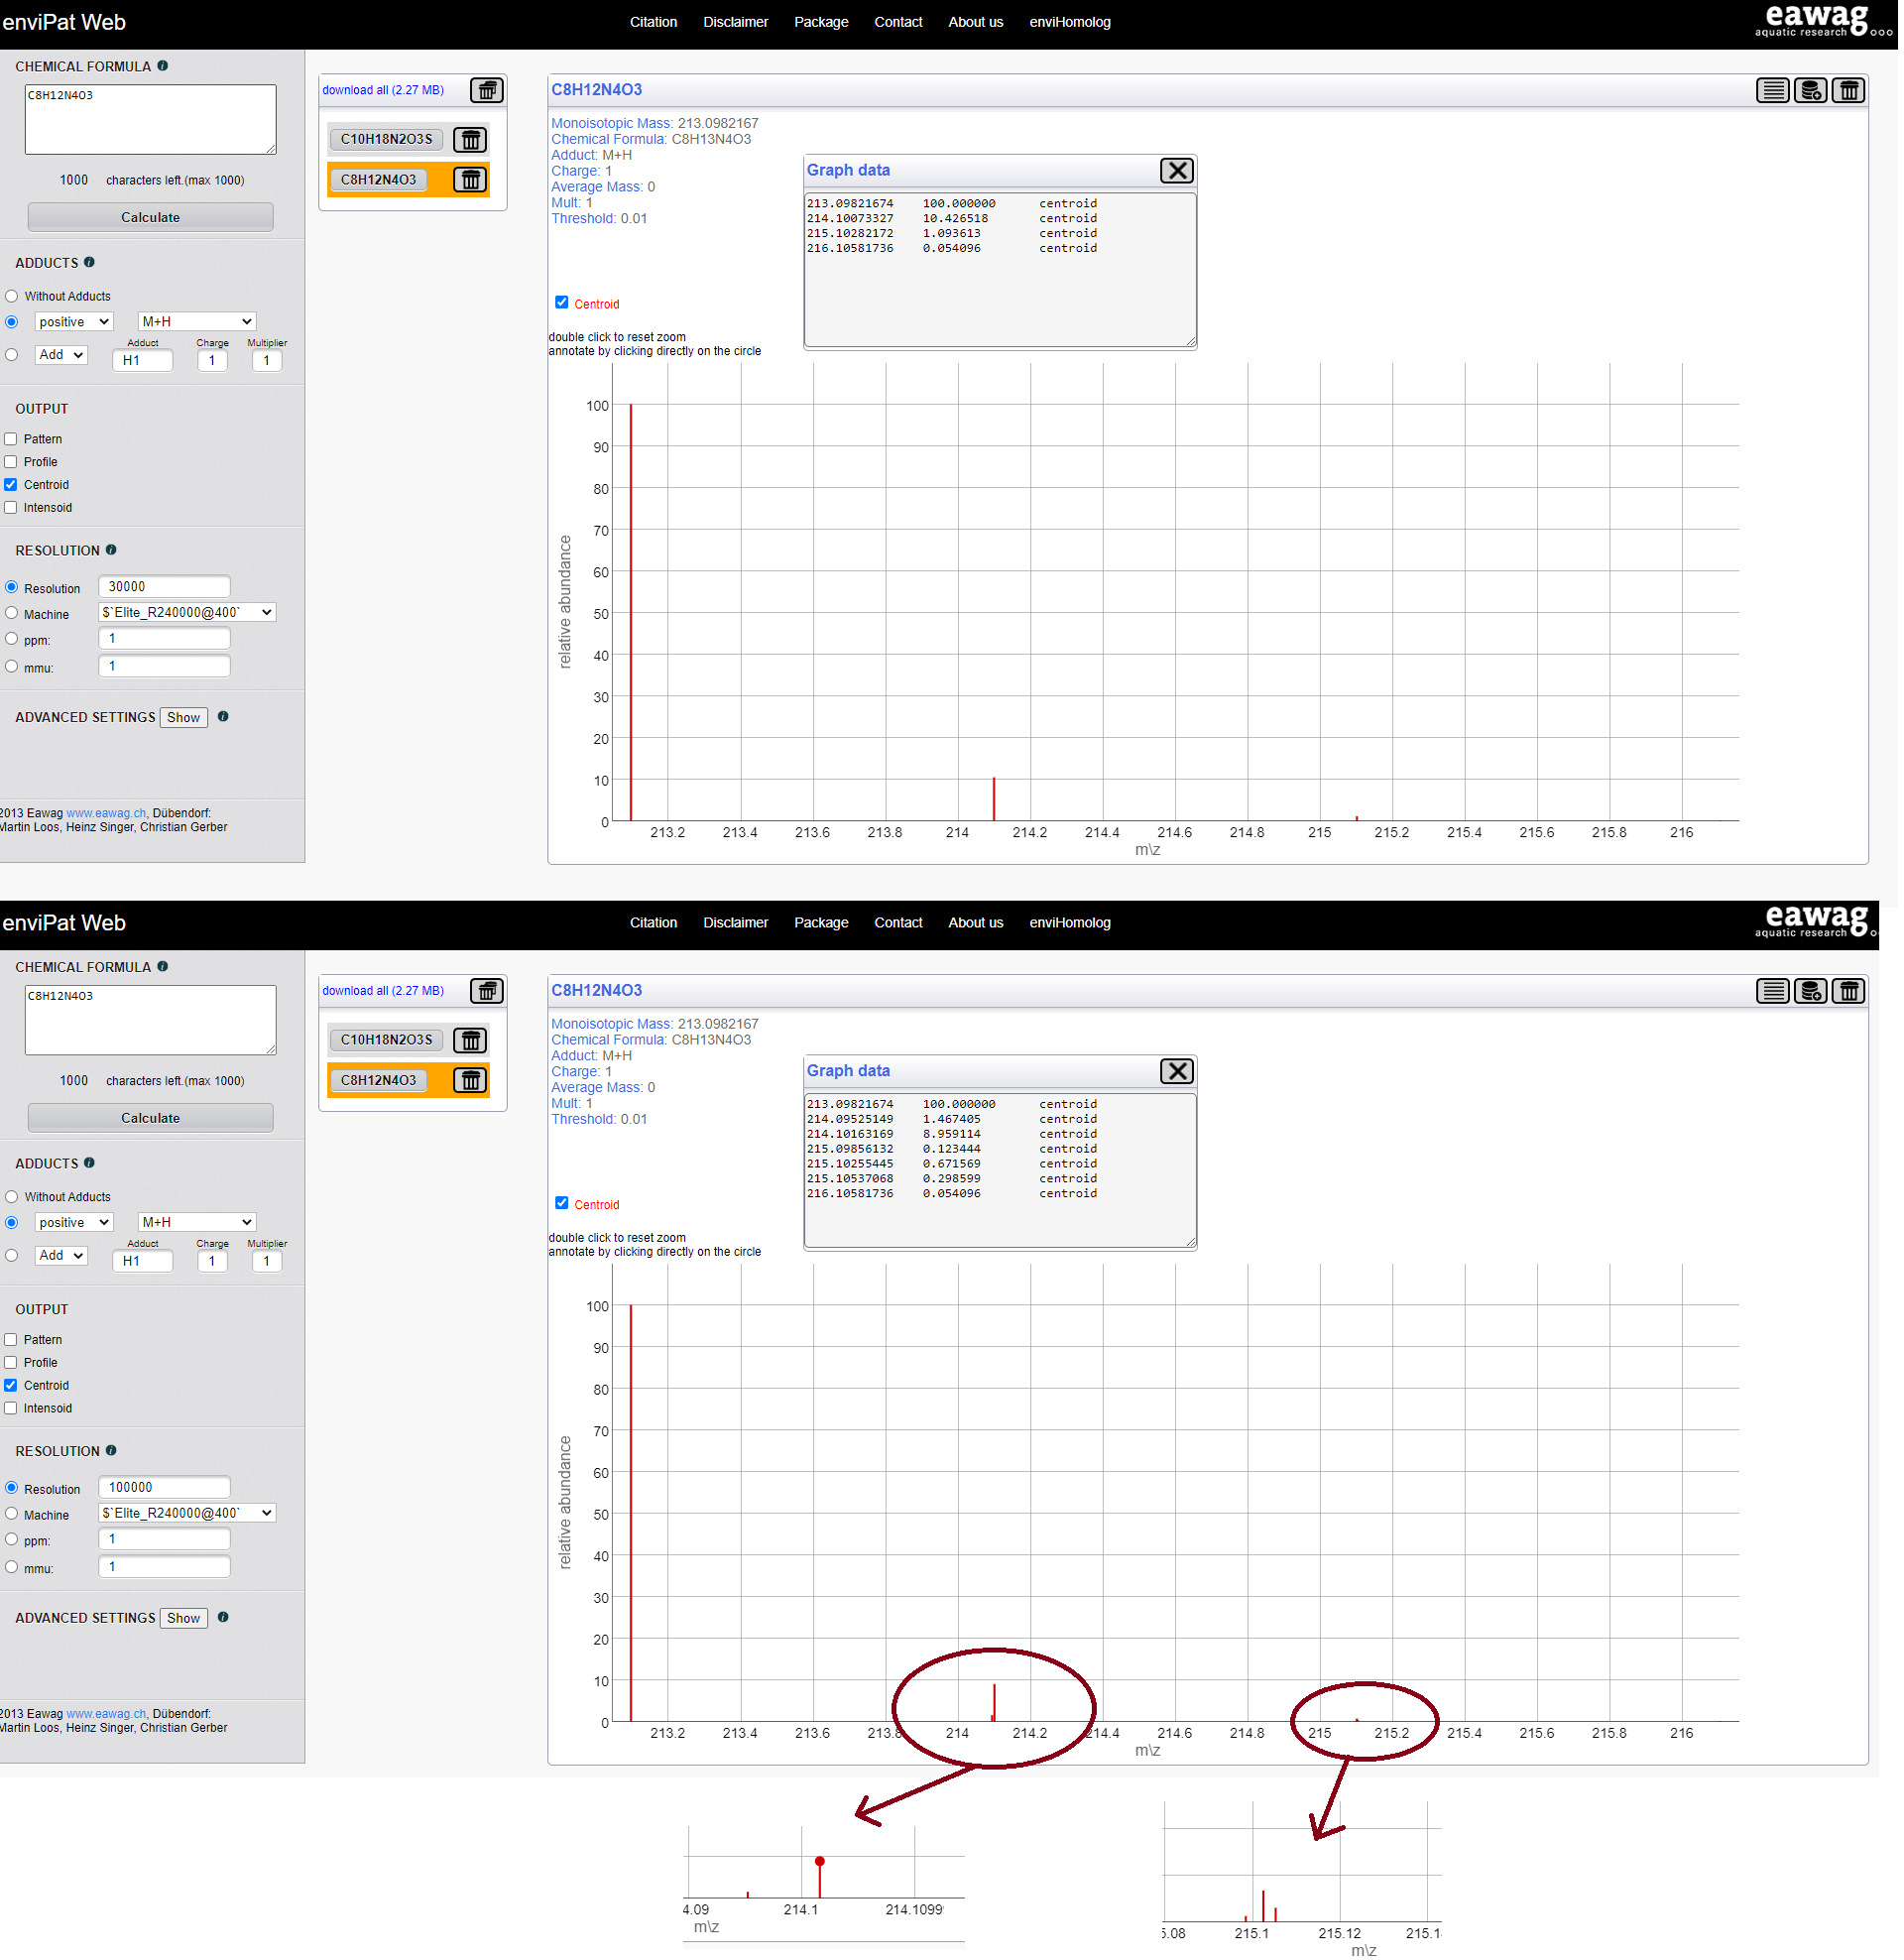
Mass resolution & Isotopic patterns
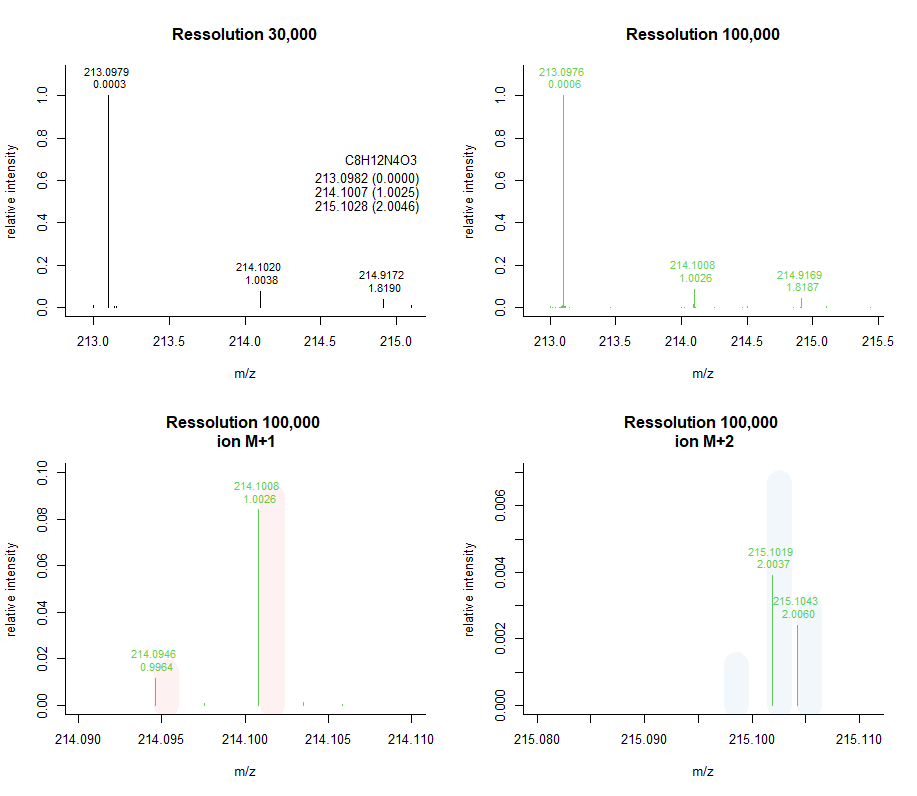
Mass resolution & Isotopic patterns
| Isotope | d(Mass) |
|---|---|
| C(12) | 0.000000 |
| C(13) | 1.003355 |
| N(14) | 0.000000 |
| N(15) | 0.997035 |
| O(16) | 0.000000 |
| O(17) | 1.004216 |
| O(18) | 2.004244 |
| H(1) | 0.000000 |
| H(2) | 1.006277 |

Mass resolution
Acquiring data at higher resolving power results in better mass accuracy, but the scan duration increases with increasing resolving power, thus diminish number of scan/peak
Mol Nutr Food Res 2019;63(1):e1800384. doi: 10.1002/mnfr.201800384
Mass resolution
Full Scan Mode
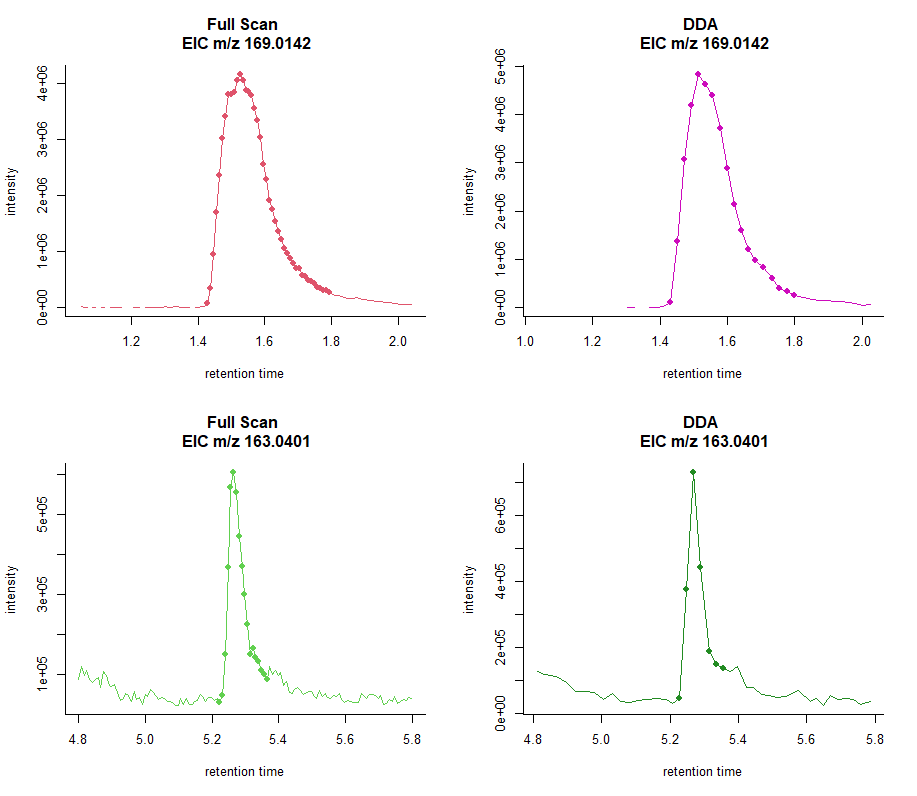
Only one MS function without induced fragmentation is acquired to generate ions of the molecular species, adducts and in-source fragments.

Mass Spectrom Rev. 2021. doi: 10.1002/mas.21715
Full Scan Mode
Acquisition performed as a full scan over a wide m/z range, depending on the particular application and/or compounds of interest.
- Lipidomics: 100 - 2,000 Da
- Metabolomics on biofluids: 70-800 Da

Mol Nutr Food Res 2019;63(1):e1800384. doi: 10.1002/mnfr.201800384
Data Dependent Acquisition Mode
The DDA mode allows the production of fragmentation spectra for structure elucidation.
The instrument acquires a full scan MS1 and, when certain criteria are met, performs a specified number of MS/MS acquisitions on the most intense ions before switching back to full scan MS1.

Mass Spectrom Rev. 2021. doi: 10.1002/mas.21715
Data Dependent Acquisition Mode
The fragmentation is only performed on the signals that meet specified and user-guided criteria:
- Signal threshold to switch from FS to MS/MS
- Number of MS/MS spectra per cycle
- Exclusion lists: static and dynamic
- Inclusion list (optional)
Mass Spectrom Rev. 2021. doi: 10.1002/mas.21715
Data Dependent Acquisition Mode

Mass Spectrom Rev. 2021. doi: 10.1002/mas.21715
Data Dependent Acquisition Mode
Mol Nutr Food Res 2019;63(1):e1800384. doi: 10.1002/mnfr.201800384
Data Dependent Acquisition Mode
mar.garcia@fmach.it